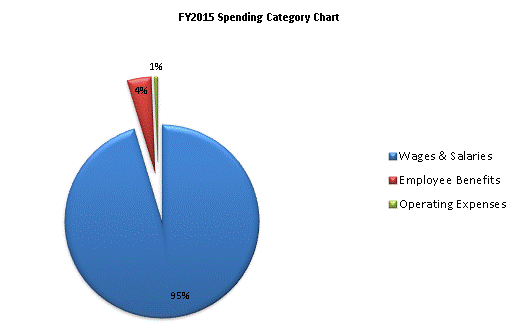
| SPENDING CATEGORY |
FY2011 Expended |
FY2012 Expended |
FY2013 Expended |
FY2014 Projected Spending * |
FY2015 House 2 |
|---|---|---|---|---|---|
| Wages & Salaries | 20,007 | 19,756 | 21,284 | 23,696 | 23,696 |
| Employee Benefits | 386 | 383 | 283 | 982 | 982 |
| Operating Expenses | 0 | 0 | 0 | 152 | 152 |
| TOTAL | 20,393 | 20,140 | 21,567 | 24,830 | 24,830 |
