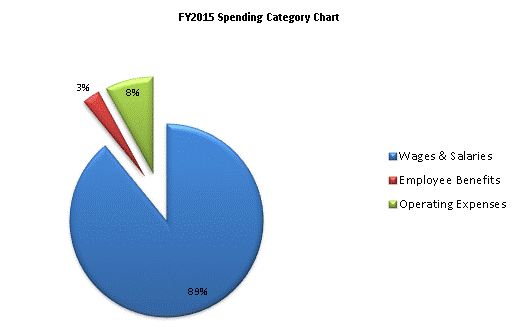
| SPENDING CATEGORY |
FY2011 Expended |
FY2012 Expended |
FY2013 Expended |
FY2014 Projected Spending * |
FY2015 House 2 |
|---|---|---|---|---|---|
| Wages & Salaries | 1,517 | 1,520 | 1,756 | 2,137 | 2,073 |
| Employee Benefits | 45 | 46 | 45 | 69 | 69 |
| Operating Expenses | 64 | 53 | 145 | 103 | 184 |
| Safety Net | 0 | 0 | 500 | 1,000 | 0 |
| Grants & Subsidies | 0 | 0 | 0 | 10 | 0 |
| TOTAL | 1,626 | 1,619 | 2,446 | 3,319 | 2,326 |
