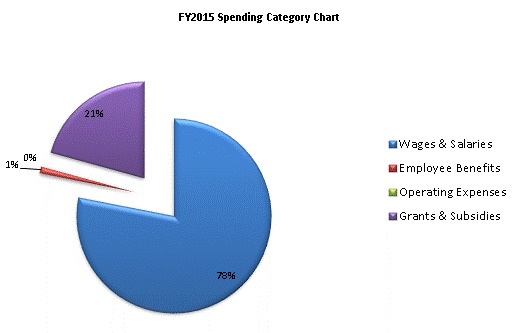
| SPENDING CATEGORY |
FY2011 Expended |
FY2012 Expended |
FY2013 Expended |
FY2014 Projected Spending * |
FY2015 House 2 |
|---|---|---|---|---|---|
| Wages & Salaries | 6,375 | 4,583 | 6,284 | 6,549 | 6,015 |
| Employee Benefits | 65 | 81 | 71 | 82 | 82 |
| Operating Expenses | 22 | 44 | 21 | 21 | 13 |
| Grants & Subsidies | 961 | 1,180 | 1,661 | 2,249 | 1,595 |
| TOTAL | 7,423 | 5,889 | 8,037 | 8,901 | 7,706 |
