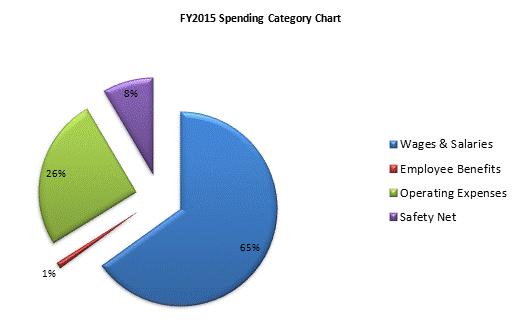
| SPENDING CATEGORY |
FY2011 Expended |
FY2012 Expended |
FY2013 Expended |
FY2014 Projected Spending * |
FY2015 House 2 |
|---|---|---|---|---|---|
| Wages & Salaries | 86,569 | 87,719 | 91,919 | 95,362 | 97,379 |
| Employee Benefits | 1,836 | 1,829 | 1,343 | 1,512 | 1,545 |
| Operating Expenses | 37,785 | 36,591 | 36,377 | 37,158 | 38,053 |
| Safety Net | 12,090 | 11,673 | 12,171 | 12,234 | 12,584 |
| TOTAL | 138,279 | 137,811 | 141,810 | 146,266 | 149,561 |
