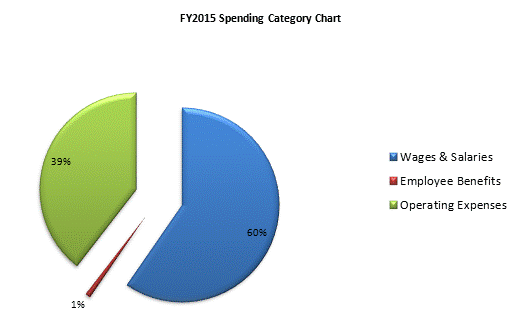
| SPENDING CATEGORY |
FY2011 Expended |
FY2012 Expended |
FY2013 Expended |
FY2014 Projected Spending * |
FY2015 House 2 |
|---|---|---|---|---|---|
| Wages & Salaries | 13,074 | 11,916 | 10,424 | 14,816 | 16,373 |
| Employee Benefits | 189 | 173 | 150 | 216 | 246 |
| Operating Expenses | 6,190 | 7,243 | 8,251 | 11,635 | 10,848 |
| TOTAL | 19,453 | 19,332 | 18,824 | 26,668 | 27,468 |