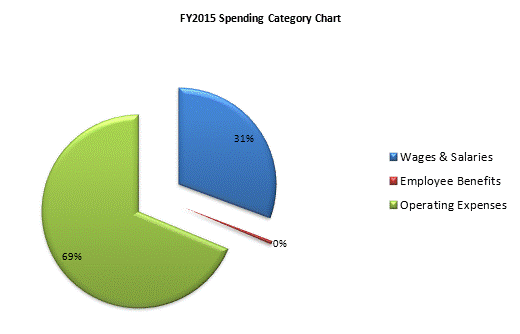
| SPENDING CATEGORY |
FY2011 Expended |
FY2012 Expended |
FY2013 Expended |
FY2014 Projected Spending * |
FY2015 House 2 |
|---|---|---|---|---|---|
| Wages & Salaries | 10,777 | 9,216 | 9,328 | 9,602 | 9,820 |
| Employee Benefits | 273 | 250 | 169 | 184 | 185 |
| Operating Expenses | 3,214 | 5,403 | 4,478 | 21,966 | 21,966 |
| TOTAL | 14,264 | 14,869 | 13,974 | 31,752 | 31,970 |