| SPENDING CATEGORY |
FY2011 Expended |
FY2012 Expended |
FY2013 Expended |
FY2014 Projected Spending * |
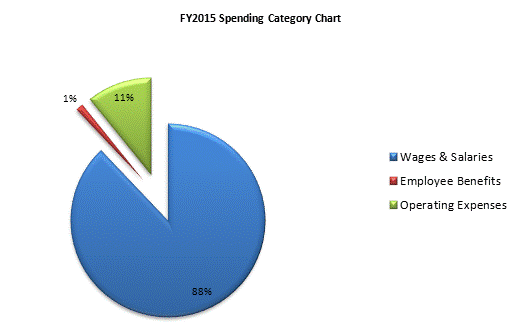
FY2015 House 2 |
|---|---|---|---|---|---|
| Wages & Salaries | 3,363 | 2,914 | 3,022 | 3,223 | 3,339 |
| Employee Benefits | 65 | 57 | 39 | 47 | 47 |
| Operating Expenses | 34 | 24 | 24 | 23 | 411 |
| TOTAL | 3,461 | 2,995 | 3,085 | 3,293 | 3,797 |
