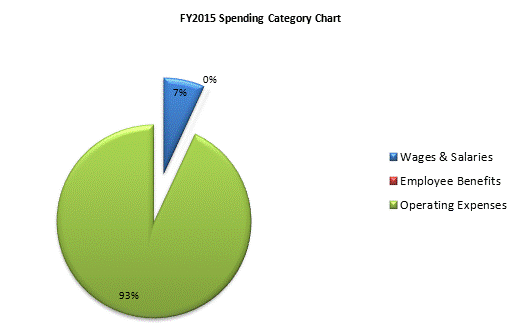
| SPENDING CATEGORY |
FY2011 Expended |
FY2012 Expended |
FY2013 Expended |
FY2014 Projected Spending * |
FY2015 House 2 |
|---|---|---|---|---|---|
| Wages & Salaries | 78 | 43 | 117 | 1,312 | 1,881 |
| Employee Benefits | 2 | 1 | 2 | 19 | 27 |
| Operating Expenses | 17,714 | 19,098 | 26,140 | 62,940 | 25,654 |
| TOTAL | 17,794 | 19,142 | 26,259 | 64,271 | 27,561 |
