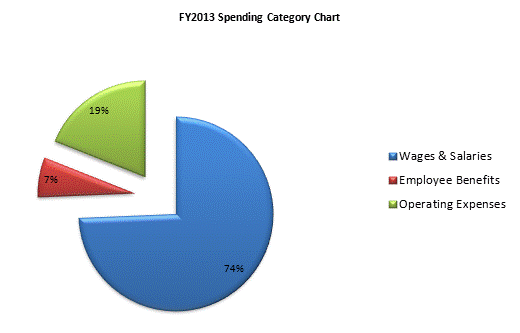
| SPENDING CATEGORY |
FY2009 Expended |
FY2010 Expended |
FY2011 Expended |
FY2012 Projected Spending * |
FY2013 House 2 |
|---|---|---|---|---|---|
| Wages & Salaries | 16,789 | 16,582 | 15,978 | 16,868 | 13,266 |
| Employee Benefits | 502 | 318 | 419 | 485 | 1,194 |
| Operating Expenses | 653 | 492 | 591 | 1,859 | 3,382 |
| TOTAL | 17,944 | 17,392 | 16,987 | 19,213 | 17,841 |
