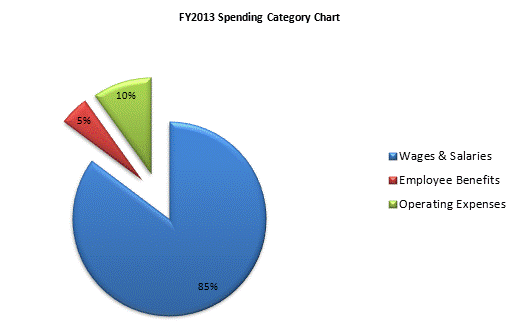
| SPENDING CATEGORY |
FY2009 Expended |
FY2010 Expended |
FY2011 Expended |
FY2012 Projected Spending * |
FY2013 House 2 |
|---|---|---|---|---|---|
| Wages & Salaries | 17,167 | 15,387 | 15,161 | 15,082 | 14,676 |
| Employee Benefits | 448 | 459 | 489 | 853 | 844 |
| Operating Expenses | 1,090 | 862 | 1,364 | 1,689 | 1,698 |
| TOTAL | 18,704 | 16,708 | 17,014 | 17,624 | 17,218 |