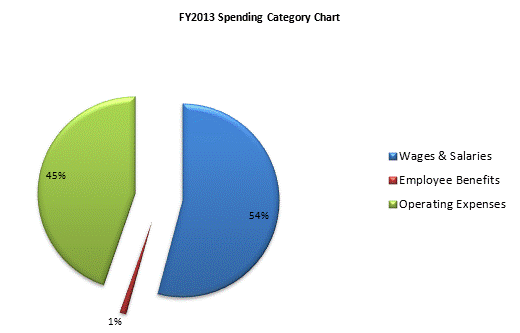
| SPENDING CATEGORY |
FY2009 Expended |
FY2010 Expended |
FY2011 Expended |
FY2012 Projected Spending * |
FY2013 House 2 |
|---|---|---|---|---|---|
| Wages & Salaries | 4,948 | 4,405 | 3,669 | 3,501 | 3,511 |
| Employee Benefits | 83 | 61 | 70 | 68 | 70 |
| Operating Expenses | 666 | 272 | 249 | 160 | 2,901 |
| TOTAL | 5,696 | 4,739 | 3,988 | 3,729 | 6,482 |
