| SPENDING CATEGORY |
FY2009 Expended |
FY2010 Expended |
FY2011 Expended |
FY2012 Projected Spending * |
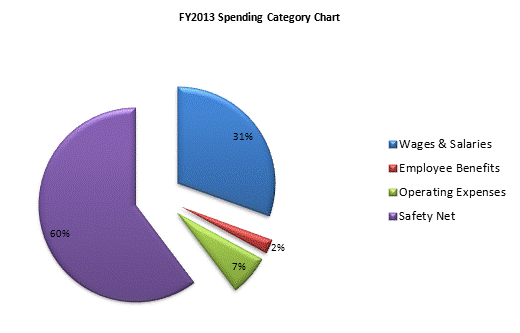
FY2013 House 2 |
|---|---|---|---|---|---|
| Wages & Salaries | 43,615 | 42,921 | 43,502 | 46,369 | 47,394 |
| Employee Benefits | 2,571 | 3,001 | 3,529 | 3,678 | 3,702 |
| Operating Expenses | 12,999 | 11,187 | 10,428 | 10,527 | 10,575 |
| Safety Net | 97,172 | 89,373 | 85,545 | 85,228 | 93,621 |
| TOTAL | 156,357 | 146,481 | 143,003 | 145,802 | 155,291 |
