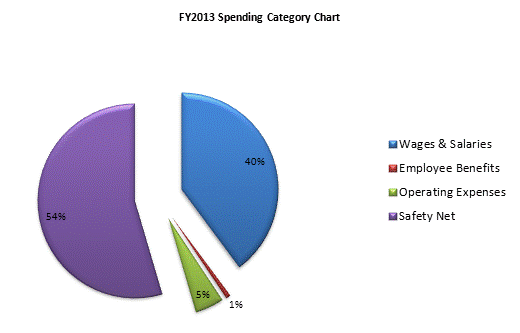
| SPENDING CATEGORY |
FY2009 Expended |
FY2010 Expended |
FY2011 Expended |
FY2012 Projected Spending * |
FY2013 House 2 |
|---|---|---|---|---|---|
| Wages & Salaries | 23,829 | 23,688 | 25,827 | 40,311 | 65,568 |
| Employee Benefits | 602 | 612 | 951 | 1,120 | 1,319 |
| Operating Expenses | 4,309 | 4,399 | 5,581 | 9,954 | 7,894 |
| Safety Net | 164,364 | 170,891 | 165,009 | 132,838 | 89,806 |
| TOTAL | 193,104 | 199,590 | 197,368 | 184,223 | 164,588 |
