| SPENDING CATEGORY |
FY2008 Expended |
FY2009 Expended |
FY2010 Expended |
FY2011 Projected Spending * |
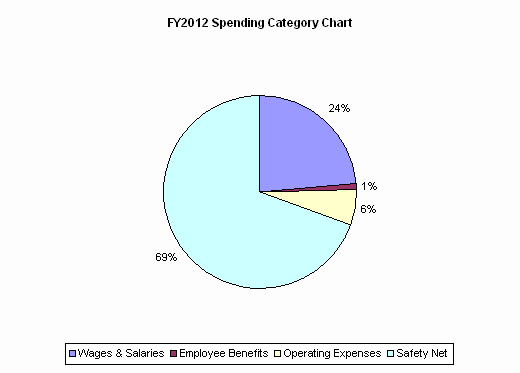
FY2012 House 1 |
|---|---|---|---|---|---|
| Wages & Salaries | 360,920 | 353,363 | 343,519 | 328,370 | 335,300 |
| Employee Benefits | 14,070 | 13,450 | 13,377 | 15,290 | 15,346 |
| Operating Expenses | 89,692 | 87,586 | 79,197 | 79,504 | 80,710 |
| Safety Net | 900,203 | 930,764 | 930,079 | 982,542 | 983,352 |
| TOTAL | 1,364,885 | 1,385,163 | 1,366,173 | 1,405,706 | 1,414,708 |
