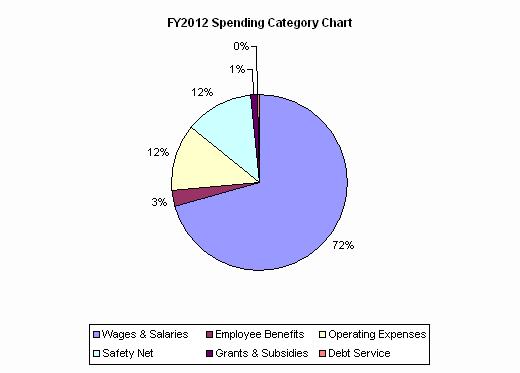
| SPENDING CATEGORY |
FY2008 Expended |
FY2009 Expended |
FY2010 Expended |
FY2011 Projected Spending * |
FY2012 House 1 |
|---|---|---|---|---|---|
| Wages & Salaries | 671,157 | 654,283 | 641,264 | 656,539 | 715,806 |
| Employee Benefits | 27,757 | 26,984 | 26,341 | 29,407 | 31,105 |
| Operating Expenses | 132,877 | 128,244 | 116,146 | 124,050 | 124,279 |
| Safety Net | 104,278 | 105,537 | 112,658 | 111,475 | 126,755 |
| Grants & Subsidies | 313,298 | 312,241 | 162,672 | 18,302 | 15,083 |
| Debt Service | 0 | 0 | 0 | 0 | 1,415 |
| TOTAL | 1,249,367 | 1,227,289 | 1,059,081 | 939,772 | 1,014,445 |
