| SPENDING CATEGORY |
FY2008 Expended |
FY2009 Expended |
FY2010 Expended |
FY2011 Projected Spending * |
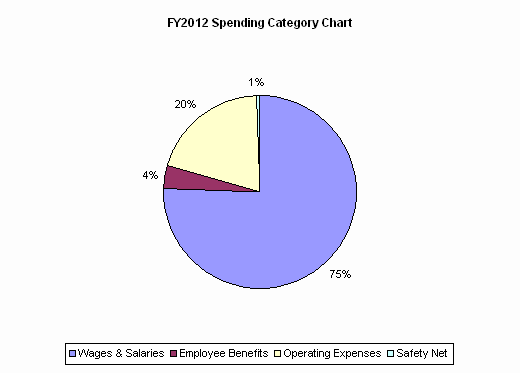
FY2012 House 1 |
|---|---|---|---|---|---|
| Wages & Salaries | 497,597 | 496,308 | 474,484 | 463,018 | 344,621 |
| Employee Benefits | 19,375 | 19,111 | 18,165 | 20,942 | 17,040 |
| Operating Expenses | 115,217 | 111,661 | 98,968 | 104,870 | 90,911 |
| Safety Net | 190,325 | 178,730 | 184,316 | 193,708 | 3,029 |
| TOTAL | 822,515 | 805,809 | 775,934 | 782,538 | 455,600 |
