| SPENDING CATEGORY |
FY2008 Expended |
FY2009 Expended |
FY2010 Expended |
FY2011 Projected Spending * |
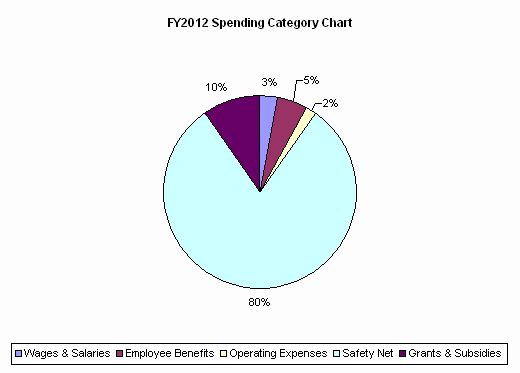
FY2012 House 1 |
|---|---|---|---|---|---|
| Wages & Salaries | 5,840 | 4,884 | 4,173 | 3,257 | 3,438 |
| Employee Benefits | 5,230 | 5,742 | 5,588 | 5,582 | 5,622 |
| Operating Expenses | 8,121 | 5,892 | 3,001 | 3,196 | 1,937 |
| Safety Net | 105,391 | 95,054 | 88,970 | 87,277 | 89,277 |
| Grants & Subsidies | 2,071 | 3,190 | 742 | 2,348 | 10,853 |
| TOTAL | 126,654 | 114,761 | 102,473 | 101,659 | 111,126 |
