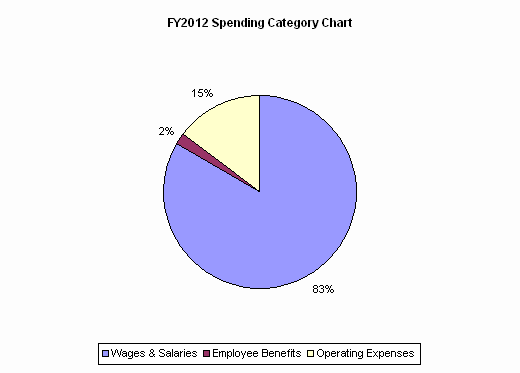
| SPENDING CATEGORY |
FY2008 Expended |
FY2009 Expended |
FY2010 Expended |
FY2011 Projected Spending * |
FY2012 House 1 |
|---|---|---|---|---|---|
| Wages & Salaries | 2,582 | 2,629 | 2,455 | 2,407 | 2,362 |
| Employee Benefits | 60 | 48 | 47 | 56 | 56 |
| Operating Expenses | 494 | 325 | 232 | 414 | 414 |
| TOTAL | 3,136 | 3,002 | 2,734 | 2,877 | 2,832 |