| SPENDING CATEGORY |
FY2008 Expended |
FY2009 Expended |
FY2010 Expended |
FY2011 Projected Spending * |
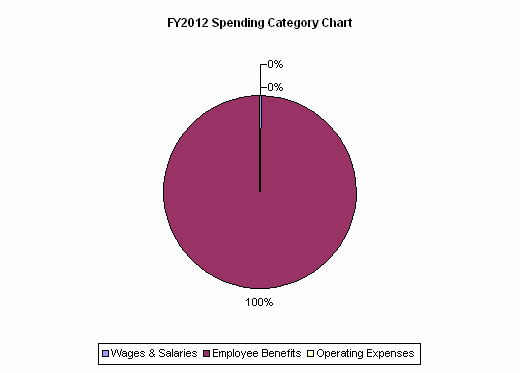
FY2012 House 1 |
|---|---|---|---|---|---|
| Wages & Salaries | 4,228 | 4,117 | 4,235 | 5,658 | 5,482 |
| Employee Benefits | 1,201,868 | 1,319,875 | 1,431,287 | 1,637,341 | 1,656,834 |
| Operating Expenses | 1,161 | 1,144 | 244 | 145 | 151 |
| TOTAL | 1,207,257 | 1,325,136 | 1,435,767 | 1,643,144 | 1,662,467 |
