| SPENDING CATEGORY |
FY2008 Expended |
FY2009 Expended |
FY2010 Expended |
FY2011 Projected Spending * |
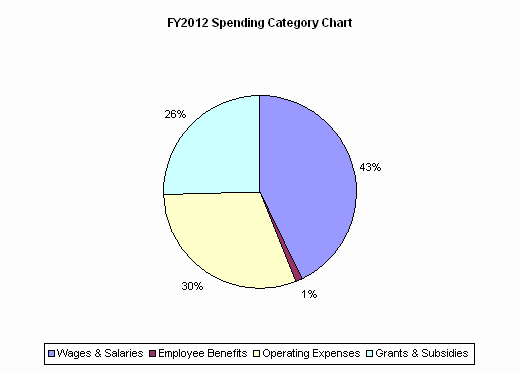
FY2012 House 1 |
|---|---|---|---|---|---|
| Wages & Salaries | 0 | 800 | 3,391 | 4,646 | 5,017 |
| Employee Benefits | 0 | 18 | 59 | 116 | 122 |
| Operating Expenses | 0 | 41 | 4,888 | 3,955 | 3,564 |
| Grants & Subsidies | 0 | 0 | 0 | 0 | 3,000 |
| TOTAL | 0 | 859 | 8,338 | 8,718 | 11,703 |
