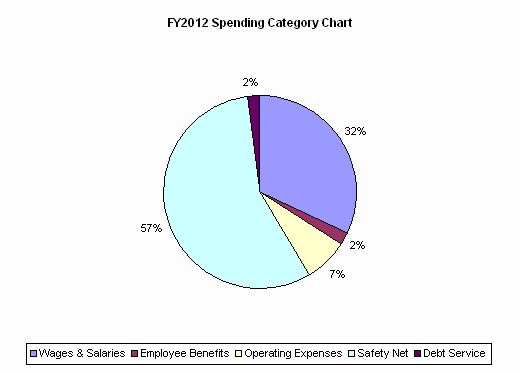
| SPENDING CATEGORY |
FY2008 Expended |
FY2009 Expended |
FY2010 Expended |
FY2011 Projected Spending * |
FY2012 House 1 |
|---|---|---|---|---|---|
| Wages & Salaries | 43,744 | 43,615 | 42,921 | 43,436 | 43,271 |
| Employee Benefits | 2,067 | 2,571 | 3,001 | 3,160 | 3,067 |
| Operating Expenses | 12,858 | 12,999 | 11,187 | 10,390 | 9,857 |
| Safety Net | 99,716 | 97,172 | 89,373 | 86,914 | 76,622 |
| Debt Service | 0 | 0 | 0 | 0 | 2,750 |
| TOTAL | 158,385 | 156,357 | 146,481 | 143,900 | 135,568 |
