| SPENDING CATEGORY |
FY2008 Expended |
FY2009 Expended |
FY2010 Expended |
FY2011 Projected Spending * |
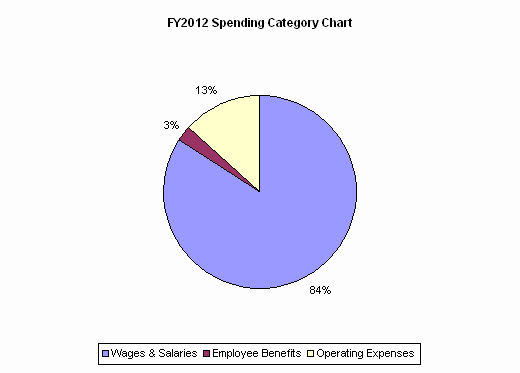
FY2012 House 1 |
|---|---|---|---|---|---|
| Wages & Salaries | 978 | 991 | 1,015 | 1,040 | 1,008 |
| Employee Benefits | 25 | 24 | 22 | 30 | 30 |
| Operating Expenses | 167 | 113 | 138 | 151 | 159 |
| TOTAL | 1,170 | 1,129 | 1,175 | 1,222 | 1,197 |
