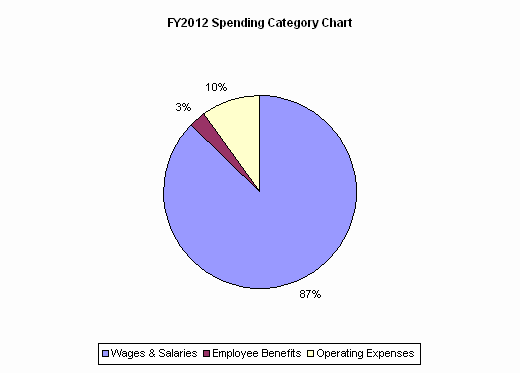
| SPENDING CATEGORY |
FY2008 Expended |
FY2009 Expended |
FY2010 Expended |
FY2011 Projected Spending * |
FY2012 House 1 |
|---|---|---|---|---|---|
| Wages & Salaries | 16,428 | 16,789 | 16,582 | 15,190 | 14,843 |
| Employee Benefits | 637 | 502 | 318 | 454 | 454 |
| Operating Expenses | 896 | 653 | 450 | 1,706 | 1,706 |
| TOTAL | 17,961 | 17,944 | 17,350 | 17,350 | 17,003 |
