| SPENDING CATEGORY |
FY2008 Expended |
FY2009 Expended |
FY2010 Expended |
FY2011 Projected Spending * |
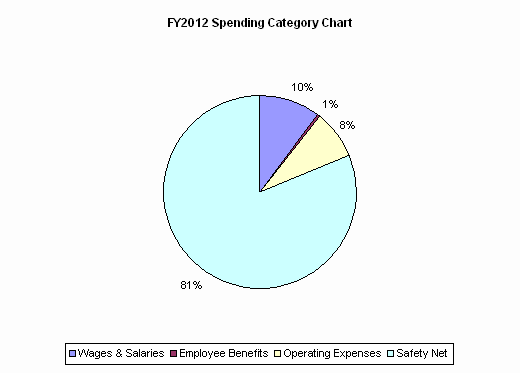
FY2012 House 1 |
|---|---|---|---|---|---|
| Wages & Salaries | 45 | 55 | 84 | 140 | 146 |
| Employee Benefits | 0 | 2 | 2 | 8 | 8 |
| Operating Expenses | 110 | 126 | 104 | 112 | 112 |
| Safety Net | 2,692 | 2,227 | 1,187 | 1,154 | 1,149 |
| TOTAL | 2,847 | 2,411 | 1,377 | 1,414 | 1,414 |
