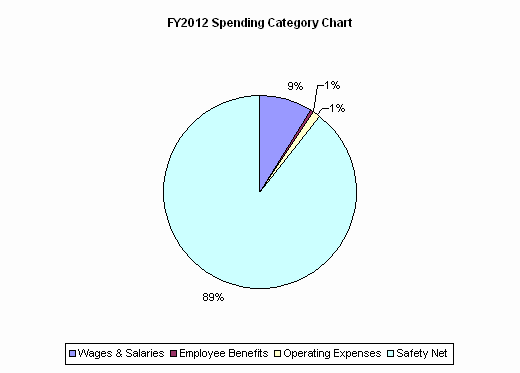
| SPENDING CATEGORY |
FY2008 Expended |
FY2009 Expended |
FY2010 Expended |
FY2011 Projected Spending * |
FY2012 House 1 |
|---|---|---|---|---|---|
| Wages & Salaries | 926 | 916 | 912 | 982 | 991 |
| Employee Benefits | 55 | 57 | 49 | 58 | 58 |
| Operating Expenses | 151 | 151 | 147 | 155 | 151 |
| Safety Net | 8,752 | 9,441 | 9,641 | 9,985 | 9,980 |
| TOTAL | 9,884 | 10,565 | 10,749 | 11,180 | 11,180 |
