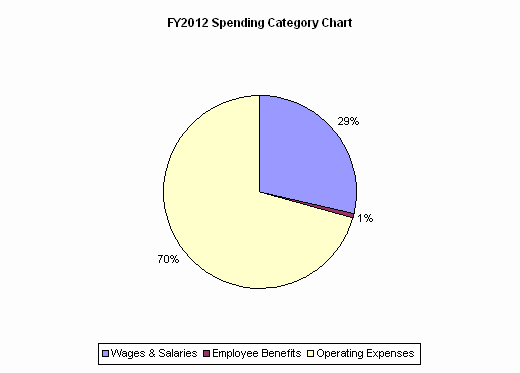
| SPENDING CATEGORY |
FY2008 Expended |
FY2009 Expended |
FY2010 Expended |
FY2011 Projected Spending * |
FY2012 House 1 |
|---|---|---|---|---|---|
| Wages & Salaries | 0 | 0 | 24,618 | 25,183 | 23,896 |
| Employee Benefits | 0 | 0 | 430 | 556 | 554 |
| Operating Expenses | 0 | 0 | 58,798 | 57,458 | 58,748 |
| TOTAL | 0 | 0 | 83,846 | 83,197 | 83,197 |
