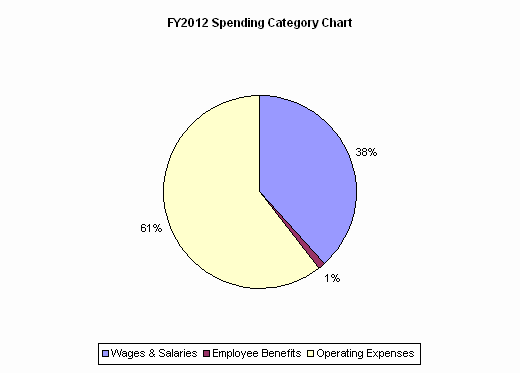
| SPENDING CATEGORY |
FY2008 Expended |
FY2009 Expended |
FY2010 Expended |
FY2011 Projected Spending * |
FY2012 House 1 |
|---|---|---|---|---|---|
| Wages & Salaries | 2,855 | 2,847 | 2,588 | 2,193 | 2,160 |
| Employee Benefits | 62 | 61 | 53 | 59 | 60 |
| Operating Expenses | 3,849 | 3,817 | 3,375 | 3,510 | 3,427 |
| Grants & Subsidies | 750 | 38 | 0 | 0 | 0 |
| TOTAL | 7,516 | 6,763 | 6,016 | 5,762 | 5,646 |
