| SPENDING CATEGORY |
FY2008 Expended |
FY2009 Expended |
FY2010 Expended |
FY2011 Projected Spending * |
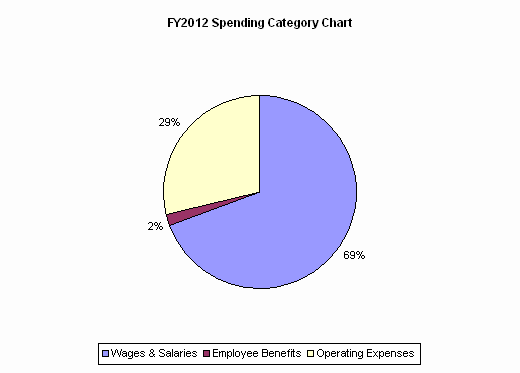
FY2012 House 1 |
|---|---|---|---|---|---|
| Wages & Salaries | 4,292 | 8,267 | 8,615 | 15,376 | 16,586 |
| Employee Benefits | 342 | 186 | 365 | 409 | 409 |
| Operating Expenses | 11,193 | 7,252 | 8,153 | 6,945 | 6,945 |
| TOTAL | 15,828 | 15,705 | 17,132 | 22,730 | 23,940 |
