| SPENDING CATEGORY |
FY2008 Expended |
FY2009 Expended |
FY2010 Expended |
FY2011 Projected Spending * |
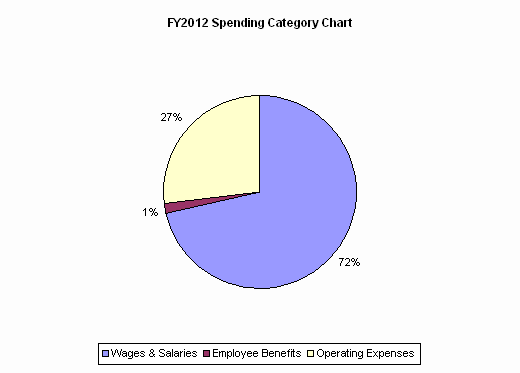
FY2012 House 1 |
|---|---|---|---|---|---|
| Wages & Salaries | 904 | 941 | 614 | 557 | 568 |
| Employee Benefits | 16 | 14 | 9 | 12 | 12 |
| Operating Expenses | 350 | 216 | 117 | 218 | 215 |
| TOTAL | 1,271 | 1,171 | 740 | 786 | 795 |
