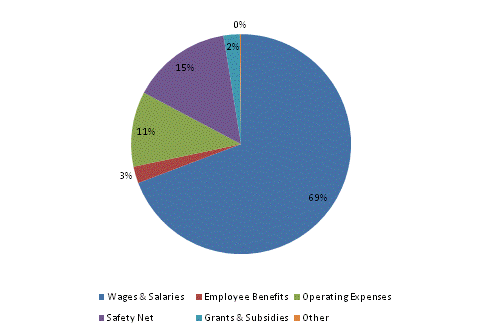
| SPENDING CATEGORY |
FY2015 Expended |
FY2016 Expended |
FY2017 Expended |
FY2018 Projected |
FY2019 GAA |
|---|---|---|---|---|---|
| Wages & Salaries | 746,687 | 753,133 | 760,535 | 770,724 | 785,142 |
| Employee Benefits | 26,647 | 27,894 | 28,308 | 28,363 | 27,880 |
| Operating Expenses | 124,202 | 123,980 | 108,769 | 127,883 | 125,292 |
| Safety Net | 108,134 | 118,668 | 128,616 | 165,074 | 166,296 |
| Grants & Subsidies | 14,074 | 20,261 | 16,953 | 13,285 | 27,142 |
| Other | 731 | 2,062 | 2,062 | 12,520 | 2,047 |
| TOTAL | 1,020,475 | 1,045,998 | 1,045,244 | 1,117,848 | 1,133,798 |
FY2019 Spending Category Chart