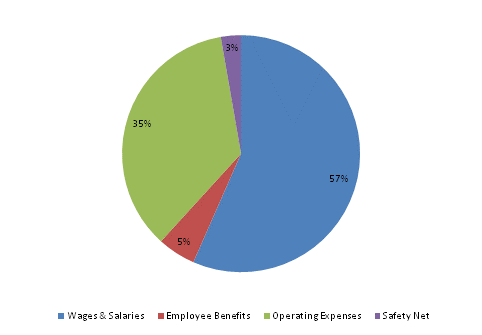
| SPENDING CATEGORY |
FY2015 Expended |
FY2016 Expended |
FY2017 Expended |
FY2018 Projected |
FY2019 GAA |
|---|---|---|---|---|---|
| Wages & Salaries | 2,294 | 2,416 | 2,455 | 5,213 | 5,213 |
| Employee Benefits | 36 | 39 | 39 | 477 | 477 |
| Operating Expenses | 5,249 | 5,875 | 8,321 | 3,267 | 3,267 |
| Safety Net | 0 | 0 | 0 | 253 | 253 |
| TOTAL | 7,579 | 8,329 | 10,816 | 9,210 | 9,210 |
FY2019 Spending Category Chart