| SPENDING CATEGORY |
FY2015 Expended |
FY2016 Expended |
FY2017 Expended |
FY2018 Projected |
FY2019 GAA |
|---|---|---|---|---|---|
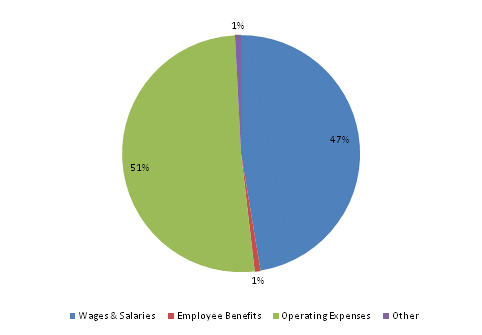
| Wages & Salaries | 14,750 | 14,887 | 13,322 | 13,908 | 13,349 |
| Employee Benefits | 215 | 265 | 222 | 223 | 224 |
| Operating Expenses | 9,967 | 9,982 | 12,699 | 14,180 | 14,376 |
| Other | 0 | 0 | 0 | 116 | 232 |
| TOTAL | 24,933 | 25,135 | 26,243 | 28,427 | 28,181 |
FY2019 Spending Category Chart
