|
FY2019 House 1 |
FY2019 House Final |
FY2019 Senate Final |
FY2019 GAA |
|
|---|---|---|---|---|
| Budget Tracking | 18,230,637 | 18,191,631 | 18,230,637 | 18,230,637 |
|
FY2016 GAA |
FY2017 GAA |
FY2018 GAA |
FY2018 Projected |
FY2019 GAA |
|
|---|---|---|---|---|---|
| Historical Budget Levels | 20,998,629 | 18,046,158 | 17,891,649 | 17,708,209 | 18,230,637 |
* GAA is General Appropriation Act.
| SPENDING CATEGORY |
FY2015 Expended |
FY2016 Expended |
FY2017 Expended |
FY2018 Projected |
FY2019 GAA |
|---|---|---|---|---|---|
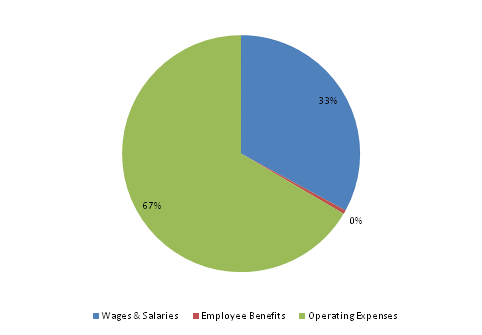
| Wages & Salaries | 6,332 | 5,954 | 5,873 | 5,934 | 6,003 |
| Employee Benefits | 110 | 103 | 106 | 92 | 93 |
| Operating Expenses | 10,454 | 11,525 | 11,358 | 11,682 | 12,135 |
| TOTAL | 16,895 | 17,582 | 17,337 | 17,708 | 18,231 |
FY2019 Spending Category Chart
