|
FY2019 House 1 |
FY2019 House Final |
FY2019 Senate Final |
FY2019 GAA |
|
|---|---|---|---|---|
| Budget Tracking | 160,615,706 | 149,107,614 | 155,943,948 | 161,745,706 |
|
FY2016 GAA |
FY2017 GAA |
FY2018 GAA |
FY2018 Projected |
FY2019 GAA |
|
|---|---|---|---|---|---|
| Historical Budget Levels | 154,873,948 | 155,533,948 | 155,878,948 | 176,216,577 | 161,745,706 |
* GAA is General Appropriation Act.
| SPENDING CATEGORY |
FY2015 Expended |
FY2016 Expended |
FY2017 Expended |
FY2018 Projected |
FY2019 GAA |
|---|---|---|---|---|---|
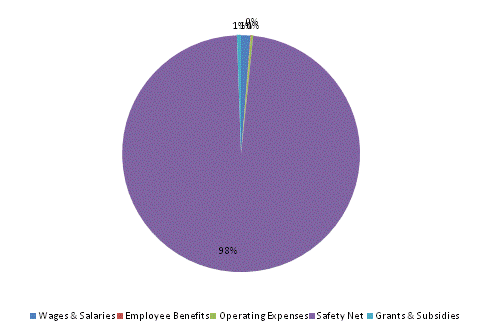
| Wages & Salaries | 4,543 | 5,873 | 2,140 | 2,075 | 2,027 |
| Employee Benefits | 137 | 137 | 116 | 132 | 128 |
| Operating Expenses | 349 | 346 | 371 | 452 | 496 |
| Safety Net | 185,856 | 188,724 | 174,793 | 171,668 | 158,172 |
| Grants & Subsidies | 914 | 904 | 888 | 1,125 | 922 |
| Other | 0 | 0 | 0 | 765 | 0 |
| TOTAL | 191,800 | 195,983 | 178,307 | 176,217 | 161,746 |
FY2019 Spending Category Chart
