|
FY2019 House 1 |
FY2019 House Final |
FY2019 Senate Final |
FY2019 GAA |
|
|---|---|---|---|---|
| Budget Tracking | 211,913,926 | 211,638,776 | 211,413,926 | 211,638,776 |
|
FY2016 GAA |
FY2017 GAA |
FY2018 GAA |
FY2018 Projected |
FY2019 GAA |
|
|---|---|---|---|---|---|
| Historical Budget Levels | 214,737,045 | 218,453,948 | 208,097,398 | 212,594,992 | 211,638,776 |
* GAA is General Appropriation Act.
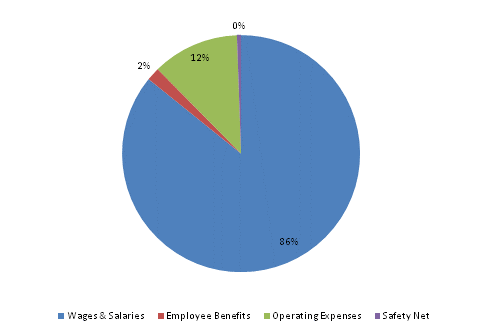
| SPENDING CATEGORY |
FY2015 Expended |
FY2016 Expended |
FY2017 Expended |
FY2018 Projected |
FY2019 GAA |
|---|---|---|---|---|---|
| Wages & Salaries | 179,748 | 182,784 | 188,604 | 179,738 | 181,571 |
| Employee Benefits | 4,342 | 4,587 | 4,471 | 8,454 | 3,825 |
| Operating Expenses | 24,026 | 22,699 | 23,167 | 24,176 | 25,057 |
| Safety Net | 730 | 1,088 | 983 | 16 | 1,187 |
| Other | 0 | 0 | 0 | 211 | 0 |
| TOTAL | 208,846 | 211,158 | 217,224 | 212,595 | 211,639 |
FY2019 Spending Category Chart