|
FY2019 House 1 |
FY2019 House Final |
FY2019 Senate Final |
FY2019 GAA |
|
|---|---|---|---|---|
| Budget Tracking | 68,888,505 | 68,858,130 | 69,038,505 | 69,038,505 |
|
FY2016 GAA |
FY2017 GAA |
FY2018 GAA |
FY2018 Projected |
FY2019 GAA |
|
|---|---|---|---|---|---|
| Historical Budget Levels | 69,918,985 | 70,068,991 | 67,753,226 | 69,418,555 | 69,038,505 |
* GAA is General Appropriation Act.
| SPENDING CATEGORY |
FY2015 Expended |
FY2016 Expended |
FY2017 Expended |
FY2018 Projected |
FY2019 GAA |
|---|---|---|---|---|---|
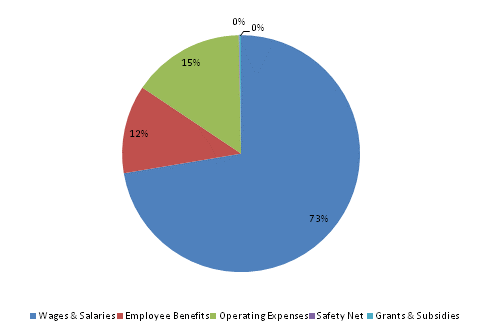
| Wages & Salaries | 49,588 | 50,181 | 53,138 | 51,866 | 49,964 |
| Employee Benefits | 7,794 | 7,999 | 8,112 | 7,935 | 8,292 |
| Operating Expenses | 6,920 | 7,471 | 8,142 | 9,465 | 10,560 |
| Safety Net | 200 | 100 | 175 | 72 | 72 |
| Grants & Subsidies | 0 | 0 | 0 | 0 | 150 |
| Other | 0 | 0 | 0 | 81 | 0 |
| TOTAL | 64,502 | 65,751 | 69,567 | 69,419 | 69,039 |
FY2019 Spending Category Chart
