|
FY2019 House 1 |
FY2019 House Final |
FY2019 Senate Final |
FY2019 GAA |
|
|---|---|---|---|---|
| Budget Tracking | 486,670,614 | 487,118,033 | 487,735,614 | 488,735,614 |
|
FY2016 GAA |
FY2017 GAA |
FY2018 GAA |
FY2018 Projected |
FY2019 GAA |
|
|---|---|---|---|---|---|
| Historical Budget Levels | 370,816,250 | 379,754,252 | 387,080,579 | 387,308,340 | 488,735,614 |
* GAA is General Appropriation Act.
| SPENDING CATEGORY |
FY2015 Expended |
FY2016 Expended |
FY2017 Expended |
FY2018 Projected |
FY2019 GAA |
|---|---|---|---|---|---|
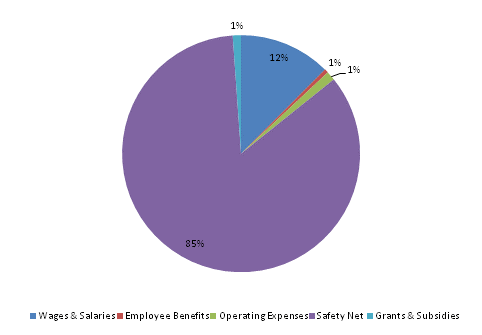
| Wages & Salaries | 57,132 | 55,941 | 57,905 | 56,714 | 60,996 |
| Employee Benefits | 2,034 | 2,055 | 2,252 | 2,380 | 2,583 |
| Operating Expenses | 3,268 | 3,310 | 3,194 | 4,545 | 6,093 |
| Safety Net | 284,056 | 311,527 | 313,168 | 319,105 | 413,550 |
| Grants & Subsidies | 903 | 1,131 | 1,433 | 3,697 | 5,514 |
| Other | 0 | 0 | 0 | 868 | 0 |
| TOTAL | 347,393 | 373,964 | 377,951 | 387,308 | 488,736 |
FY2019 Spending Category Chart
