|
FY2019 House 1 |
FY2019 House Final |
FY2019 Senate Final |
FY2019 GAA |
|
|---|---|---|---|---|
| Budget Tracking | 156,964,356 | 157,407,572 | 158,104,041 | 158,254,041 |
|
FY2016 GAA |
FY2017 GAA |
FY2018 GAA |
FY2018 Projected |
FY2019 GAA |
|
|---|---|---|---|---|---|
| Historical Budget Levels | 154,536,238 | 155,250,383 | 155,400,383 | 154,191,492 | 158,254,041 |
* GAA is General Appropriation Act.
| SPENDING CATEGORY |
FY2015 Expended |
FY2016 Expended |
FY2017 Expended |
FY2018 Projected |
FY2019 GAA |
|---|---|---|---|---|---|
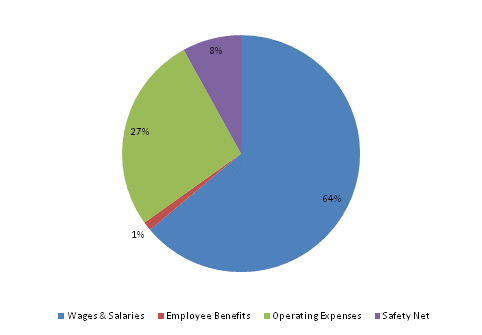
| Wages & Salaries | 98,070 | 95,017 | 99,010 | 99,132 | 101,159 |
| Employee Benefits | 1,804 | 1,978 | 1,978 | 1,906 | 1,908 |
| Operating Expenses | 37,901 | 38,228 | 37,651 | 40,721 | 42,457 |
| Safety Net | 12,049 | 11,813 | 12,127 | 12,405 | 12,730 |
| Other | 0 | 0 | 0 | 28 | 0 |
| TOTAL | 149,824 | 147,036 | 150,767 | 154,191 | 158,254 |
FY2019 Spending Category Chart
