|
FY2019 House 1 |
FY2019 House Final |
FY2019 Senate Final |
FY2019 GAA |
|
|---|---|---|---|---|
| Budget Tracking | 3,434,369 | 3,884,369 | 3,659,369 | 4,059,369 |
|
FY2016 GAA |
FY2017 GAA |
FY2018 GAA |
FY2018 Projected |
FY2019 GAA |
|
|---|---|---|---|---|---|
| Historical Budget Levels | 3,437,386 | 3,929,010 | 4,110,977 | 3,889,853 | 4,059,369 |
* GAA is General Appropriation Act.
| SPENDING CATEGORY |
FY2015 Expended |
FY2016 Expended |
FY2017 Expended |
FY2018 Projected |
FY2019 GAA |
|---|---|---|---|---|---|
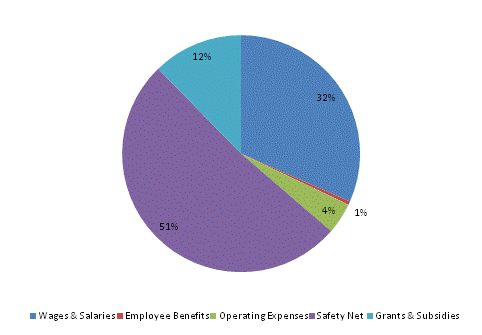
| Wages & Salaries | 962 | 1,107 | 977 | 1,459 | 1,282 |
| Employee Benefits | 14 | 16 | 19 | 19 | 20 |
| Operating Expenses | 139 | 76 | 97 | 168 | 172 |
| Safety Net | 1,895 | 1,900 | 1,751 | 1,642 | 2,085 |
| Grants & Subsidies | 383 | 493 | 550 | 600 | 500 |
| Other | 0 | 0 | 0 | 1 | 0 |
| TOTAL | 3,393 | 3,592 | 3,393 | 3,890 | 4,059 |
FY2019 Spending Category Chart
