|
FY2019 House 1 |
FY2019 House Final |
FY2019 Senate Final |
FY2019 GAA |
|
|---|---|---|---|---|
| Budget Tracking | 136,123,457 | 137,173,457 | 141,783,457 | 141,863,457 |
|
FY2016 GAA |
FY2017 GAA |
FY2018 GAA |
FY2018 Projected |
FY2019 GAA |
|
|---|---|---|---|---|---|
| Historical Budget Levels | 90,424,904 | 125,692,987 | 132,575,888 | 135,593,404 | 141,863,457 |
* GAA is General Appropriation Act.
| SPENDING CATEGORY |
FY2015 Expended |
FY2016 Expended |
FY2017 Expended |
FY2018 Projected |
FY2019 GAA |
|---|---|---|---|---|---|
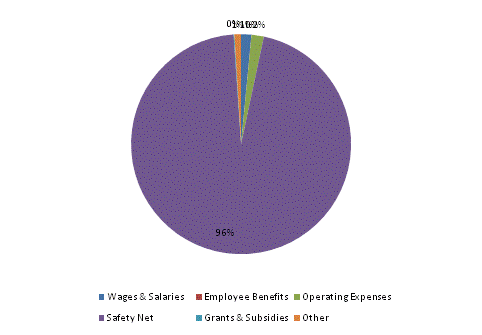
| Wages & Salaries | 1,173 | 1,517 | 2,337 | 1,716 | 2,139 |
| Employee Benefits | 13 | 10 | 10 | 12 | 12 |
| Operating Expenses | 710 | 1,407 | 1,701 | 2,470 | 2,572 |
| Safety Net | 89,613 | 104,327 | 115,930 | 131,395 | 135,579 |
| Grants & Subsidies | 0 | 765 | 0 | 0 | 184 |
| Other | 0 | 0 | 0 | 1 | 1,378 |
| TOTAL | 91,509 | 108,026 | 119,979 | 135,593 | 141,863 |
FY2019 Spending Category Chart
