|
FY2019 House 1 |
FY2019 House Final |
FY2019 Senate Final |
FY2019 GAA |
|
|---|---|---|---|---|
| Budget Tracking | 15,614,075 | 16,200,000 | 16,364,075 | 16,364,075 |
|
FY2016 GAA |
FY2017 GAA |
FY2018 GAA |
FY2018 Projected |
FY2019 GAA |
|
|---|---|---|---|---|---|
| Historical Budget Levels | 14,659,292 | 15,898,807 | 15,898,807 | 16,083,047 | 16,364,075 |
* GAA is General Appropriation Act.
| SPENDING CATEGORY |
FY2015 Expended |
FY2016 Expended |
FY2017 Expended |
FY2018 Projected |
FY2019 GAA |
|---|---|---|---|---|---|
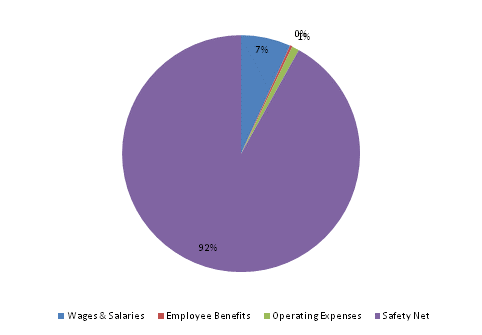
| Wages & Salaries | 1,064 | 889 | 1,232 | 1,053 | 1,109 |
| Employee Benefits | 52 | 50 | 56 | 50 | 53 |
| Operating Expenses | 162 | 151 | 152 | 155 | 162 |
| Safety Net | 13,319 | 14,555 | 14,690 | 14,711 | 15,040 |
| Other | 0 | 0 | 0 | 114 | 0 |
| TOTAL | 14,598 | 15,644 | 16,129 | 16,083 | 16,364 |
FY2019 Spending Category Chart
