|
FY2019 House 1 |
FY2019 House Final |
FY2019 Senate Final |
FY2019 GAA |
|
|---|---|---|---|---|
| Budget Tracking | 13,714,942 | 13,714,924 | 13,714,942 | 13,714,924 |
|
FY2016 GAA |
FY2017 GAA |
FY2018 GAA |
FY2018 Projected |
FY2019 GAA |
|
|---|---|---|---|---|---|
| Historical Budget Levels | 13,167,056 | 13,183,460 | 13,575,558 | 13,435,375 | 13,714,924 |
* GAA is General Appropriation Act.
| SPENDING CATEGORY |
FY2015 Expended |
FY2016 Expended |
FY2017 Expended |
FY2018 Projected |
FY2019 GAA |
|---|---|---|---|---|---|
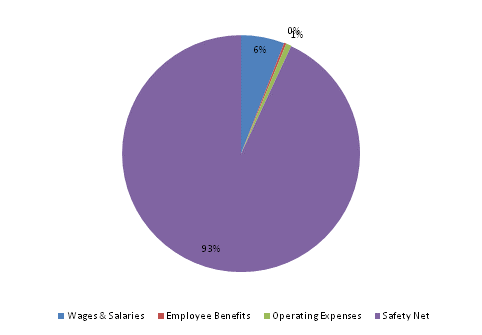
| Wages & Salaries | 897 | 801 | 972 | 813 | 811 |
| Employee Benefits | 31 | 37 | 42 | 40 | 40 |
| Operating Expenses | 109 | 96 | 193 | 101 | 101 |
| Safety Net | 11,578 | 11,748 | 11,693 | 12,481 | 12,763 |
| TOTAL | 12,615 | 12,682 | 12,901 | 13,435 | 13,715 |
FY2019 Spending Category Chart
