|
FY2019 House 1 |
FY2019 House Final |
FY2019 Senate Final |
FY2019 GAA |
|
|---|---|---|---|---|
| Budget Tracking | 27,431,406 | 27,431,406 | 27,431,406 | 27,431,406 |
|
FY2016 GAA |
FY2017 GAA |
FY2018 GAA |
FY2018 Projected |
FY2019 GAA |
|
|---|---|---|---|---|---|
| Historical Budget Levels | 29,467,892 | 27,631,406 | 27,431,406 | 27,861,023 | 27,431,406 |
* GAA is General Appropriation Act.
| SPENDING CATEGORY |
FY2015 Expended |
FY2016 Expended |
FY2017 Expended |
FY2018 Projected |
FY2019 GAA |
|---|---|---|---|---|---|
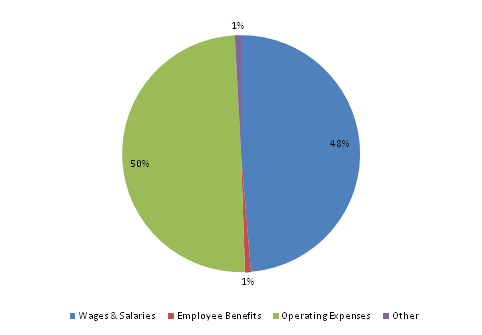
| Wages & Salaries | 14,750 | 14,887 | 13,322 | 13,908 | 13,349 |
| Employee Benefits | 215 | 261 | 222 | 223 | 224 |
| Operating Expenses | 9,721 | 9,550 | 12,314 | 13,614 | 13,626 |
| Other | 0 | 0 | 0 | 116 | 232 |
| TOTAL | 24,686 | 24,699 | 25,859 | 27,861 | 27,431 |
FY2019 Spending Category Chart
