|
FY2019 House 1 |
FY2019 House Final |
FY2019 Senate Final |
FY2019 GAA |
|
|---|---|---|---|---|
| Budget Tracking | 103,379,599 | 103,877,269 | 104,038,044 | 104,535,714 |
|
FY2016 GAA |
FY2017 GAA |
FY2018 GAA |
FY2018 Projected |
FY2019 GAA |
|
|---|---|---|---|---|---|
| Historical Budget Levels | 90,898,463 | 100,501,087 | 102,682,373 | 99,333,530 | 104,535,714 |
* GAA is General Appropriation Act.
| SPENDING CATEGORY |
FY2015 Expended |
FY2016 Expended |
FY2017 Expended |
FY2018 Projected |
FY2019 GAA |
|---|---|---|---|---|---|
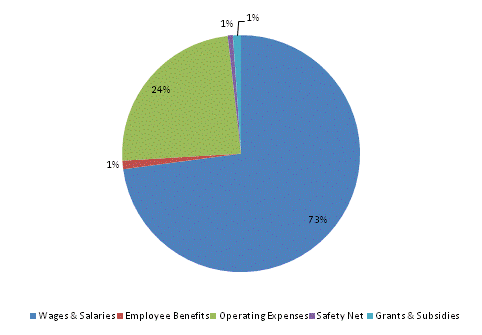
| Wages & Salaries | 63,059 | 59,245 | 73,347 | 70,964 | 76,218 |
| Employee Benefits | 1,247 | 1,161 | 1,308 | 1,209 | 1,198 |
| Operating Expenses | 22,334 | 21,563 | 19,316 | 23,779 | 25,236 |
| Safety Net | 656 | 686 | 927 | 537 | 728 |
| Grants & Subsidies | 0 | 2,870 | 2,420 | 2,420 | 1,156 |
| Other | 0 | 0 | 0 | 425 | 0 |
| TOTAL | 87,296 | 85,525 | 97,318 | 99,334 | 104,536 |
FY2019 Spending Category Chart
