|
FY2019 House 1 |
FY2019 House Final |
FY2019 Senate Final |
FY2019 GAA |
|
|---|---|---|---|---|
| Budget Tracking | 2,733,863 | 2,733,864 | 2,733,863 | 2,733,864 |
|
FY2016 GAA |
FY2017 GAA |
FY2018 GAA |
FY2018 Projected |
FY2019 GAA |
|
|---|---|---|---|---|---|
| Historical Budget Levels | 10,449,800 | 13,449,800 | 10,910,789 | 11,075,956 | 2,733,864 |
* GAA is General Appropriation Act.
| SPENDING CATEGORY |
FY2015 Expended |
FY2016 Expended |
FY2017 Expended |
FY2018 Projected |
FY2019 GAA |
|---|---|---|---|---|---|
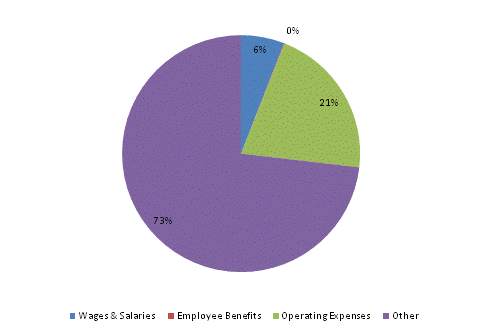
| Wages & Salaries | 277 | 529 | 235 | 161 | 161 |
| Employee Benefits | 4 | 9 | 4 | 2 | 2 |
| Operating Expenses | 95 | 1,660 | 4,384 | 4,873 | 570 |
| Other | 0 | 0 | 0 | 6,040 | 2,000 |
| TOTAL | 377 | 2,197 | 4,623 | 11,076 | 2,734 |
FY2019 Spending Category Chart
