|
FY2019 House 1 |
FY2019 House Final |
FY2019 Senate Final |
FY2019 GAA |
|
|---|---|---|---|---|
| Budget Tracking | 17,877,276 | 19,375,589 | 21,265,155 | 21,265,155 |
|
FY2016 GAA |
FY2017 GAA |
FY2018 GAA |
FY2018 Projected |
FY2019 GAA |
|
|---|---|---|---|---|---|
| Historical Budget Levels | 18,740,487 | 18,992,783 | 18,754,597 | 17,700,273 | 21,265,155 |
* GAA is General Appropriation Act.
| SPENDING CATEGORY |
FY2015 Expended |
FY2016 Expended |
FY2017 Expended |
FY2018 Projected |
FY2019 GAA |
|---|---|---|---|---|---|
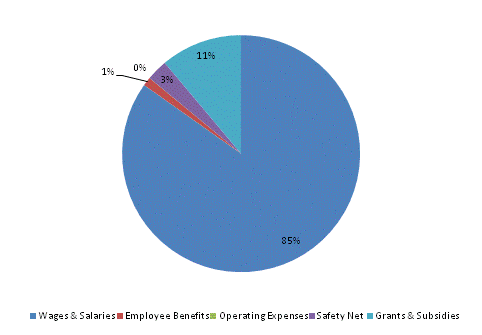
| Wages & Salaries | 16,787 | 17,293 | 17,501 | 16,850 | 18,031 |
| Employee Benefits | 266 | 285 | 290 | 238 | 252 |
| Operating Expenses | 3 | 3 | 3 | 0 | 3 |
| Safety Net | 417 | 622 | 647 | 613 | 613 |
| Grants & Subsidies | 0 | 0 | 0 | 0 | 2,367 |
| TOTAL | 17,473 | 18,203 | 18,441 | 17,700 | 21,265 |
FY2019 Spending Category Chart
