|
FY2019 House 1 |
FY2019 House Final |
FY2019 Senate Final |
FY2019 GAA |
|
|---|---|---|---|---|
| Budget Tracking | 239,329,937 | 240,849,802 | 240,823,826 | 241,651,751 |
|
FY2016 GAA |
FY2017 GAA |
FY2018 GAA |
FY2018 Projected |
FY2019 GAA |
|
|---|---|---|---|---|---|
| Historical Budget Levels | 214,812,830 | 239,872,058 | 228,933,576 | 236,960,333 | 241,651,751 |
* GAA is General Appropriation Act.
| SPENDING CATEGORY |
FY2015 Expended |
FY2016 Expended |
FY2017 Expended |
FY2018 Projected |
FY2019 GAA |
|---|---|---|---|---|---|
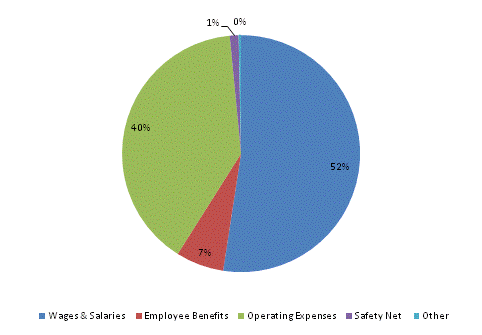
| Wages & Salaries | 112,660 | 115,071 | 119,082 | 121,087 | 126,698 |
| Employee Benefits | 15,303 | 14,679 | 14,902 | 15,727 | 15,820 |
| Operating Expenses | 81,928 | 95,884 | 91,034 | 96,564 | 95,427 |
| Safety Net | 3,059 | 2,580 | 2,739 | 2,776 | 2,900 |
| Other | 657 | 766 | 807 | 807 | 807 |
| TOTAL | 213,606 | 228,980 | 228,564 | 236,960 | 241,652 |
FY2019 Spending Category Chart
