| SPENDING CATEGORY |
FY2014 Expended |
FY2015 Expended |
FY2016 Expended |
FY2017 Projected |
FY2018 GAA |
|---|---|---|---|---|---|
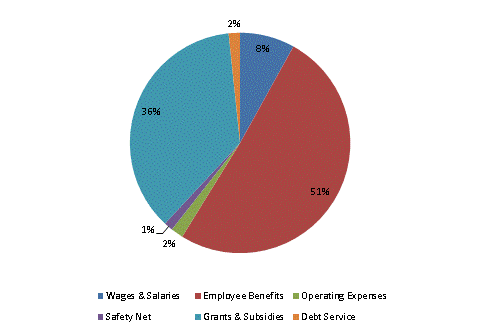
| Wages & Salaries | 190,387 | 188,006 | 167,422 | 186,141 | 281,457 |
| Employee Benefits | 1,428,357 | 1,673,936 | 1,684,318 | 1,689,131 | 1,774,383 |
| Operating Expenses | 71,818 | 70,776 | 57,978 | 59,812 | 63,825 |
| Safety Net | 12,733 | 15,053 | 31,034 | 20,088 | 45,707 |
| Grants & Subsidies | 1,112,798 | 1,136,747 | 1,177,343 | 1,215,871 | 1,272,592 |
| Debt Service | 62,577 | 61,851 | 59,964 | 53,462 | 58,129 |
| TOTAL | 2,878,670 | 3,146,368 | 3,178,059 | 3,224,506 | 3,496,093 |
FY2018 Spending Category Chart
