| SPENDING CATEGORY |
FY2014 Expended |
FY2015 Expended |
FY2016 Expended |
FY2017 Projected |
FY2018 GAA |
|---|---|---|---|---|---|
| Wages & Salaries | 1,727 | 2,529 | 3,402 | 3,263 | 3,779 |
| Employee Benefits | 31 | 47 | 79 | 105 | 118 |
| Operating Expenses | 1,685 | 1,570 | 1,829 | 1,559 | 1,912 |
| Grants & Subsidies | 14,826 | 21,105 | 11,882 | 5,039 | 6,299 |
| TOTAL | 18,269 | 25,251 | 17,192 | 9,966 | 12,108 |
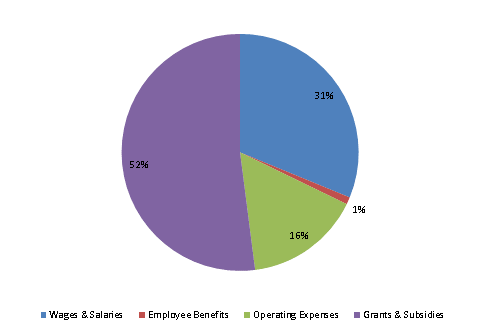
FY2018 Spending Category Chart