| SPENDING CATEGORY |
FY2014 Expended |
FY2015 Expended |
FY2016 Expended |
FY2017 Projected |
FY2018 GAA |
|---|---|---|---|---|---|
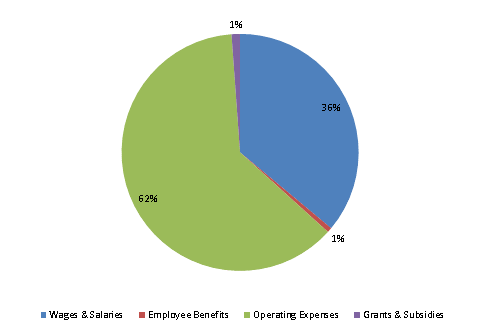
| Wages & Salaries | 6,709 | 8,575 | 7,992 | 7,993 | 7,810 |
| Employee Benefits | 116 | 152 | 141 | 149 | 141 |
| Operating Expenses | 11,522 | 11,991 | 13,051 | 12,882 | 13,457 |
| Safety Net | 19 | 0 | 0 | 0 | 0 |
| Grants & Subsidies | 3,766 | 3,174 | 1,112 | 2,048 | 250 |
| Debt Service | 0 | 0 | 0 | 0 | 0 |
| TOTAL | 22,132 | 23,893 | 22,296 | 23,072 | 21,659 |
FY2018 Spending Category Chart
